Mature hydrocarbon fields: advanced visualization and production time evolution
- Angel Aponte

- Mar 18, 2023
- 3 min read
Updated: Jan 5, 2024
Most giant and shallow hydrocarbon fields have already been discovered; exploration activities in deep and ultra-deep horizons are expensive. Currently, the biggest technological challenge in the Oil and Gas industry is to optimize hydrocarbon recovery in existing mature fields. Millions of barrels (cubic meters) remain trapped underground, waiting for technologies that identify and recover those resources. Once the remaining oil is pinned down (see the red pockets in the simulated Oil Saturation time-evolution in the animation below), the selection and implementation of the best production action will guarantee an increase in profit for the company.

New technologies in the area of Data Mining, Machine Learning, Time-Series Analysis, and Advanced Visual Analytics have been used successfully in several knowledge domains; however, their applications in the optimization of hydrocarbon production of mature fields, particularly in Latin America, have been limited in identifying and applying these technologies. Optimizing oil production and recovery will undoubtedly improve and SUSTAINABLY INCREASE the financial benefits of the operator.

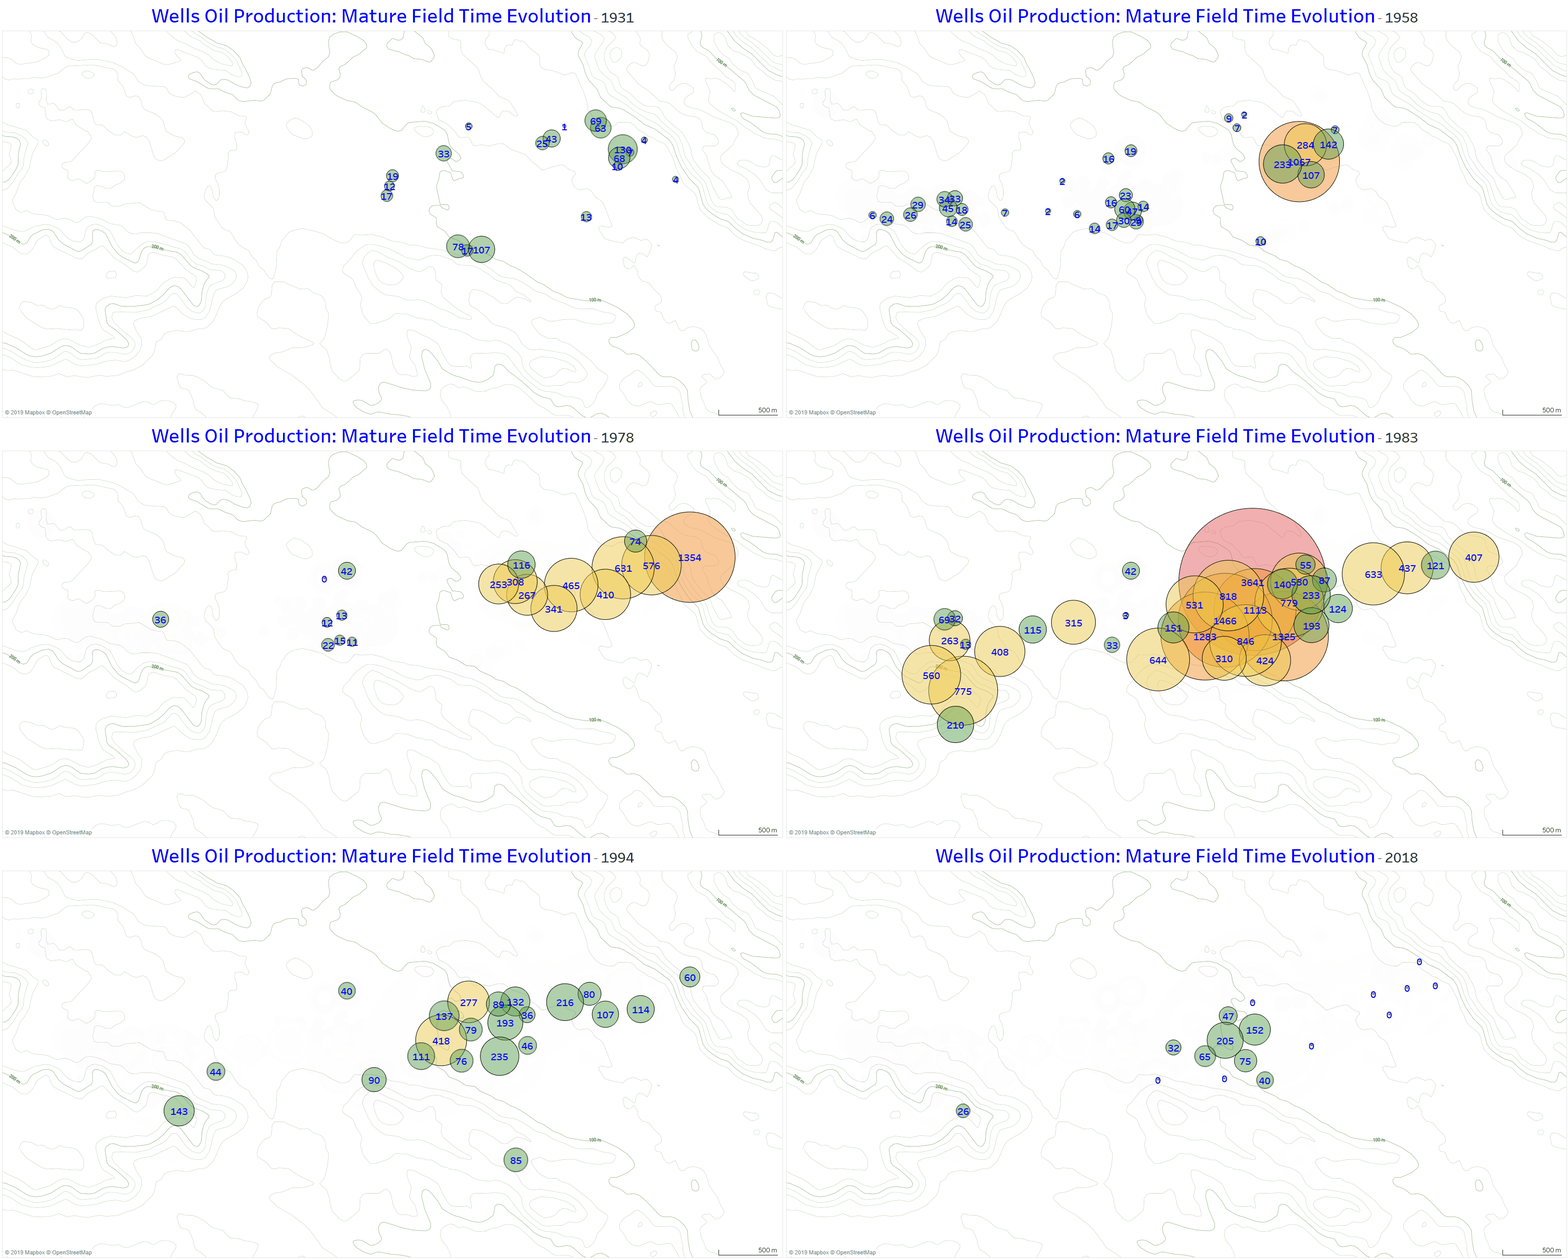
In this post, I present an example of the application of ADVANCED VISUALIZATION techniques that are currently used in the Retail domain: I address the history/temporal evolution of the production of a mature oil field in Argentina. The data corresponds to almost 90 years of production, from January 1931 to October 2018. This was a huge dataset, and handling it required a lot of data preparation and feature engineering. The figure above shows a CLASSIC BUBBLE map, a traditional static snapshot used to visualize the accumulated production of hydrocarbon fields.
Such maps pop up areas with the highest production but are limited to showing only a particular time point of the dynamic and complex process. On the other hand, the animation below (built with TABLEAU software) shows the full-time evolution of this mature field. The emerging patterns can easily be spotted and associated with historical field events. The classic bubble map's perfect complement.
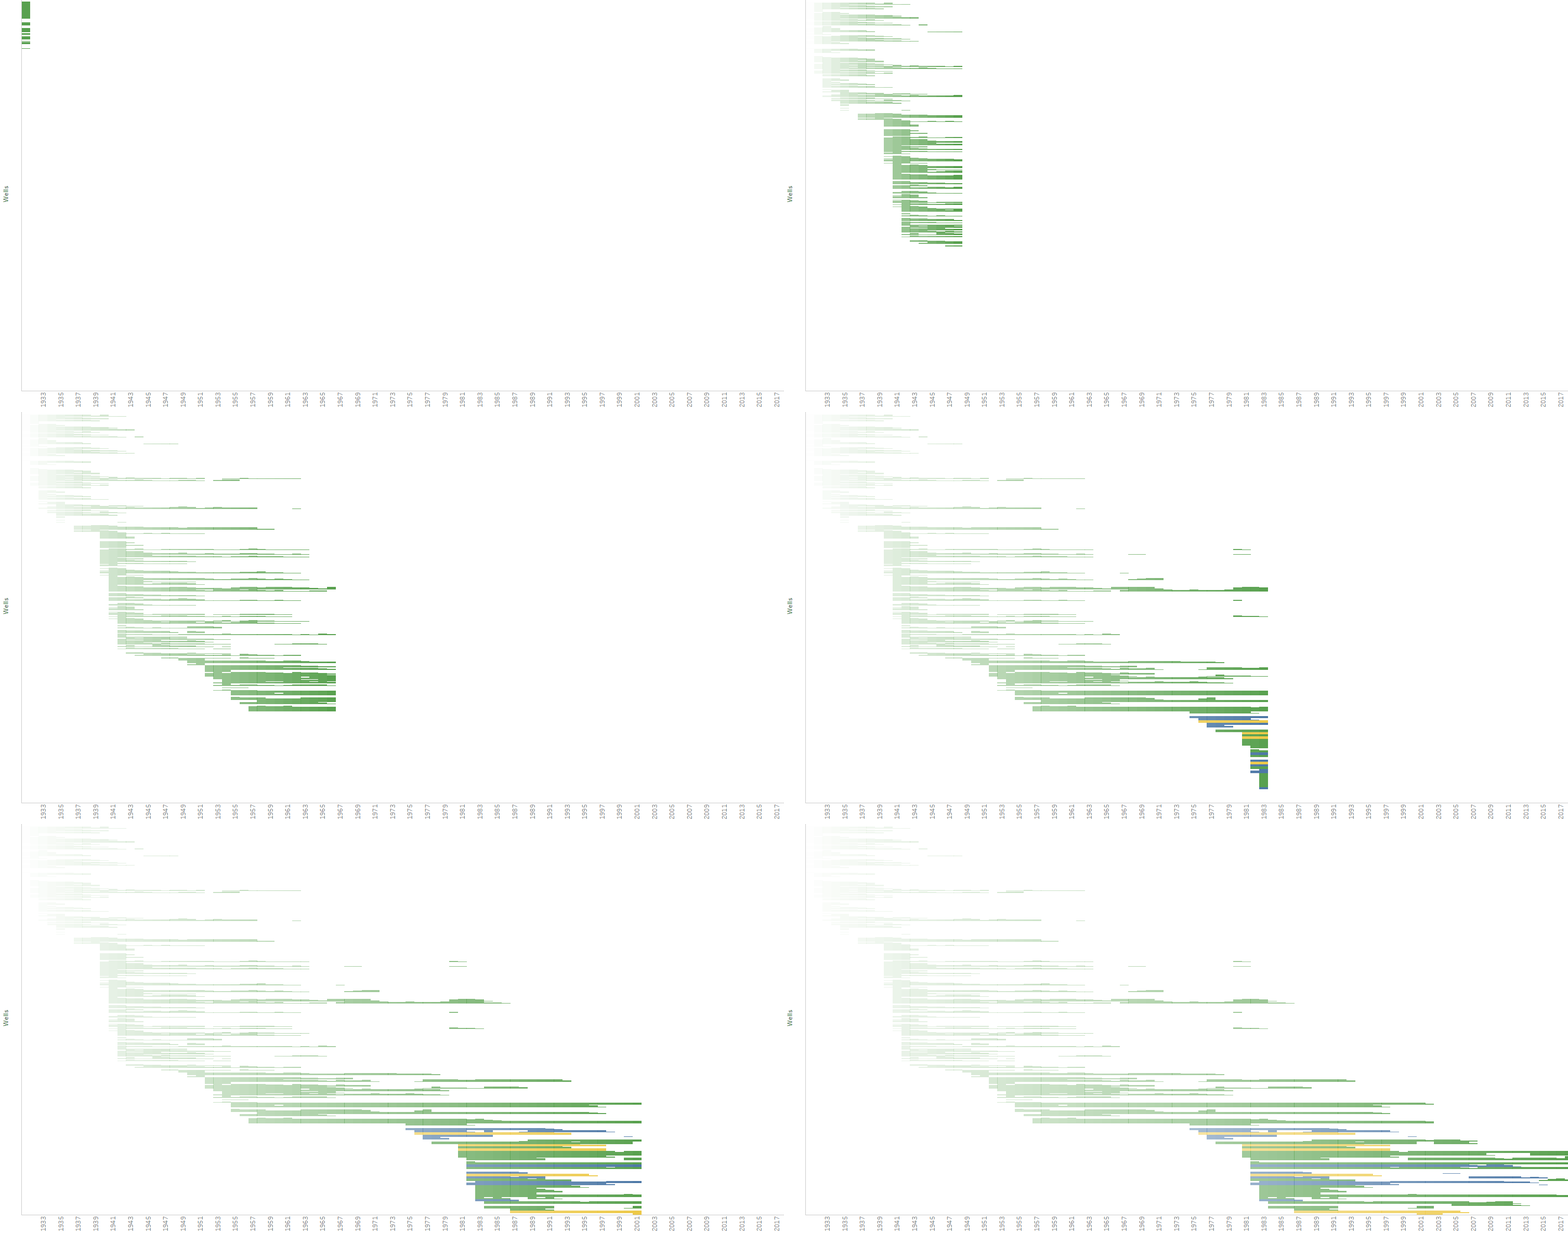
Indeed, from 1939 to approximately 1945, a substantial increase in activity (new wells, the opening of new intervals, etc.) could be directly related that WWII was ongoing. Also, the sharp increase in the early eighties could be related to the increment in oil prices (embargo of Middle East producers) and the introduction of new production technologies. And so on.
These statements can be corroborated in the animation above, which shows an (advanced) scatter plot where time runs along the horizontal axis while the number of wells are on the vertical axis. Again, it is clear that during the time windows corresponding to WWII and the early eighties, more wells were drilled, and (or) intervals were opened, which resulted in a substantial increase in oil production. The increment in production is particularly notable in the last period referred to since water injection projects and other EOR technologies appear to have been implemented in the field.
As an epilogue, it is worth saying that despite almost a century of exploitation; there are still opportunities in this mature field. Hundreds, even thousands of barrels/m3 of oil, could remain trapped on the subsurface waiting to be recovered. It is definitely a great challenge to delineate the areas of By-Passed Oil and quantify the remaining resources. However, with a large amount of data/information available, and the application of methods/techniques (Data Mining, Visual Analytics, Machine Learning, Time Series Analysis, etc.) that discover/extract additional insight/knowledge from complex datasets, it is possible to identify locations for new in-field wells (vertical, deviated, etc.), and new intervals to perforate, both in new and existing wells. A geostatistical/stochastic model of the reservoir that explicitly takes into account the geometry and distribution of sedimentary bodies will be also required; this is necessary for a more accurate evaluation of fluid distributions, as well as for the quantification and analysis of uncertainties.
The above analysis again illustrates how conventional Oil and Gas workflows could be enriched with Advanced Visualization Techniques and other methods based on Data Analytics and Geomodeling. To the extent that problems are approached from this new DATA-DRIVEN perspective, unsuspected actionable insight can be made available, and more complex issues can be successfully addressed. Of course, this knowledge can be used immediately to provide practical solutions and support the decision making leading to increase revenue.
Please leave your comments below, and kindly share and contact me if you require additional information. I'll be delighted to answer all your questions.


Comments